:::: MENU ::::
Browsing posts in: Azure

Python Azure Function application error – underlying container unavailable

Recently I’ve been having some issues with Python Azure Functions that after deployment the underlying container was down. Redeployment, restart doesn’t help and still you can see this screen.

🙁 Application Error
If you are the application administrator, you can access the diagnostic resources.

After some investigation I’ve found out in Azure Function “Availability and Performance” diagnostics that there is a following error:

ERROR: unhandled error in functions worker: Descriptors cannot not be created directly.

After further checks it looks like it’s related to the profobuf library. Even though I’m not using it directly it looks like some of the libraries is using this library.

Solution

Add proper version to your requirements.txt file:

protobuf==3.20.*

and redeploy the app. This solution solved my problem.


Azure DevOps / NuGet Restore – intermittent CredentialProvider.Microsoft fails

##[error]The nuget command failed with exit code(1) and error(Problem starting the plugin 'C:\vsts-agents\smh-agent-3\_work\_tasks\NuGetCommand_333b11bd-d341-40d9-afcf-b32d5ce6f23b\2.211.0\CredentialProviderV2\plugins\netfx\CredentialProvider.Microsoft\CredentialProvider.Microsoft.exe'. Plugin 'CredentialProvider.Microsoft' failed within 6.581 seconds with exit code -1.

This annoying error was intermittent and happened mostly when several builds were running.

I’m using two steps related to NuGet:
NuGet tool installer v1
NuGet v2 – configured for restoring packages for the project

I’ve discovered this thread on Visual Studio Developer Community that suggest that it may be an issue with default NuGet timeout, which is 5 seconds.

The suggestion is to increase the default timeout, which works for me.

I’ve set within build variables two new variables and so far it works better – no more CredentialProvider.Microsoft error.

NUGET_PLUGIN_HANDSHAKE_TIMEOUT_IN_SECONDS=30
NUGET_PLUGIN_REQUEST_TIMEOUT_IN_SECONDS=30

How to change tenant in Microsoft Graph Explorer

If you have multiple Active Directory tenants you work with and you’d like to use Microsoft Graph Explorer to interact with Microsoft Graph API you often have a need to switch between tenants.

Unfortunately, as of now, Microsoft Graph Explorer does not support switching tenant in their standard view. There is a workaround though!

You can pass tenant name in the URL, as follows:

https://developer.microsoft.com/en-us/graph/graph-explorer?tenant=YOUR_TENANT.onmicrosoft.com

Important!

If you are already signed in with your main tenant, you will have to switch account – click on your profile and then Sign in with a different account. If you have account on the other tenant you should be able to switch account. After doing so, the information about the tenant (next to you profile) should be updated!

Source


How to update Azure DevOps Service Principal connection once expired

When you use Azure DevOps to deploy your projects you can connect it to Azure via different methods. The most convenient type of service connection is `Azure Resource Manager using service principal authentication`.

This type of connection creates application in your Azure Active Directory which is used as a Service Principal. Then for this application secret is generated, so Azure DevOps can connect to Azure. This secret token is expiring from time to time. The default time to live is 2 years but it may vary.

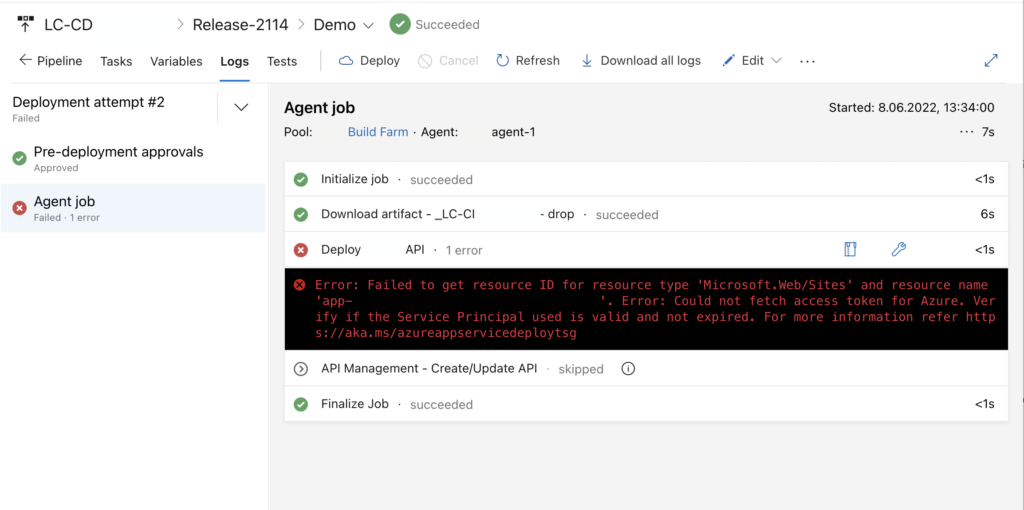
Once the secret is expired you will get this type of error when trying to deploy your code to Azure:

##[error]Error: Failed to get resource ID for resource type 'Microsoft.Web/Sites' and resource name 'XXX'. Error: Could not fetch access token for Azure. Verify if the Service Principal used is valid and not expired. For more information refer https://aka.ms/azureappservicedeploytsg
Error during deployment once secret for Service Principal expired.
Continue Reading

Azure Log Analytics / Application Insights – search everywhere

If you have Azure Log Analytics or Application Insights, where you have different data sources, like exceptions, requests, traces, customEvents, you may want to search for some certain phrase everywhere, because you don’t know in which data source you should check or in which column.

There is quite handy way of doing that – search in query.

Quick example:

search in (exceptions, requests, traces, customEvents) "ManagedIdentityCredential"

And details in documentation.


Print all environment variables in Azure DevOps for Linux Agents with Bash

If you are looking how to achieve the same goal with Windows agents and PowerShell see Print all environment variables in Azure DevOps for Windows Agents with Powershell.

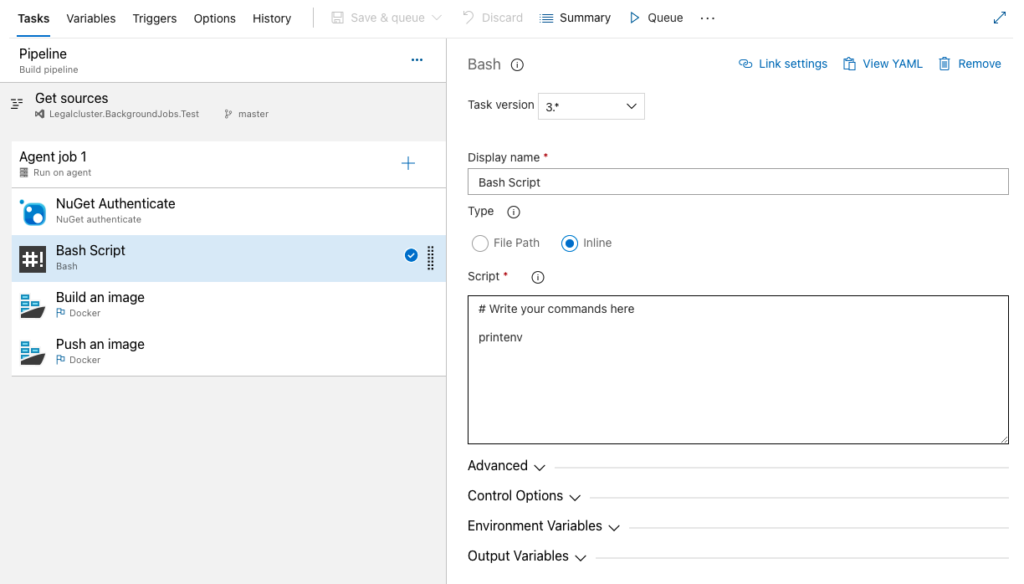
If you’d like to see all the environment variables configured during your build or release on Linux agent just add the Bash task with:

printenv

so it looks like

Bash task with printenv

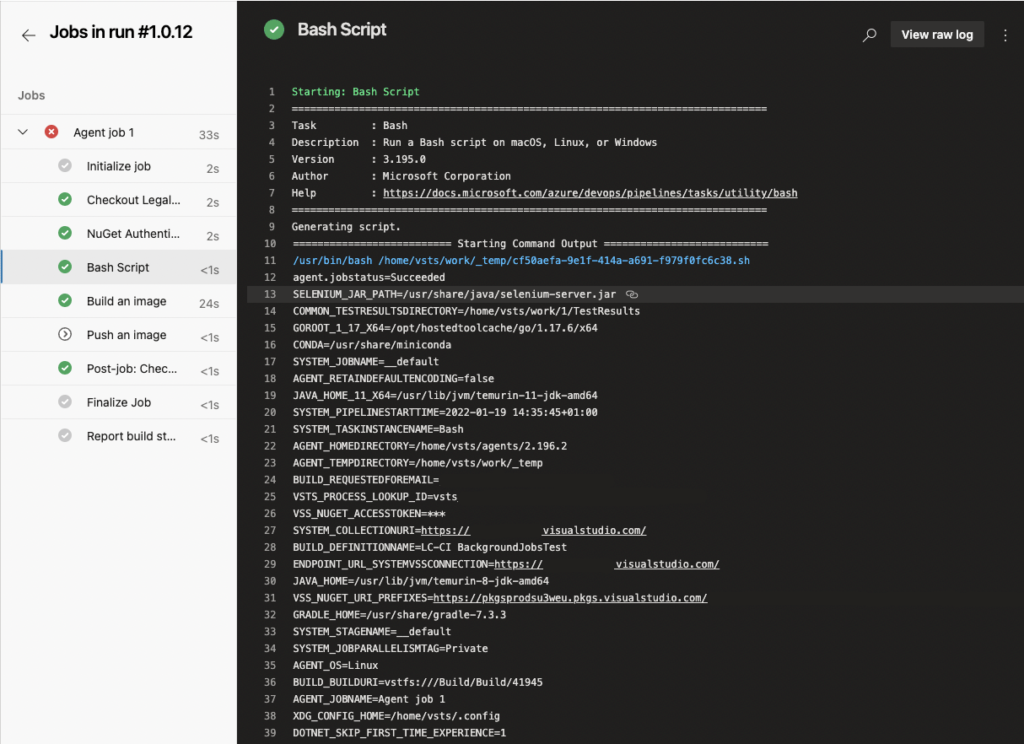
and when you’ll execute your build or release pipeline you should be able to see all the environment variables:


Print all environment variables in Azure DevOps for Windows Agents with Powershell

If you are looking how to achieve the same goal with Linux agents and Bash see Print all environment variables in Azure DevOps for Linux Agents with Bash.

OK, so I had a problem with trying to figure out which variables are available for me and what are their values – Microsoft documentation is not always that helpful on that. As inspired by Mohit Goyal post I would like to share the same idea – on how to debug all the available variables but this time on those machines where you don’t have bash but powershell instead.

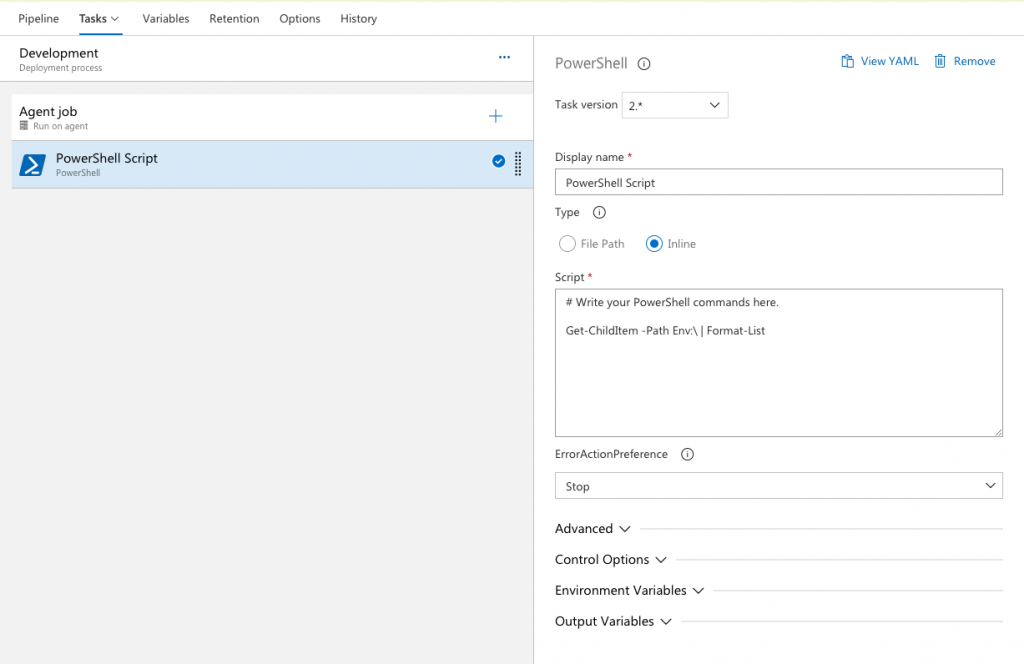
Just add to your pipeline PowerShell task, switch to inline script and fill the script

Get-ChildItem -Path Env:\ | Format-List

so it looks like

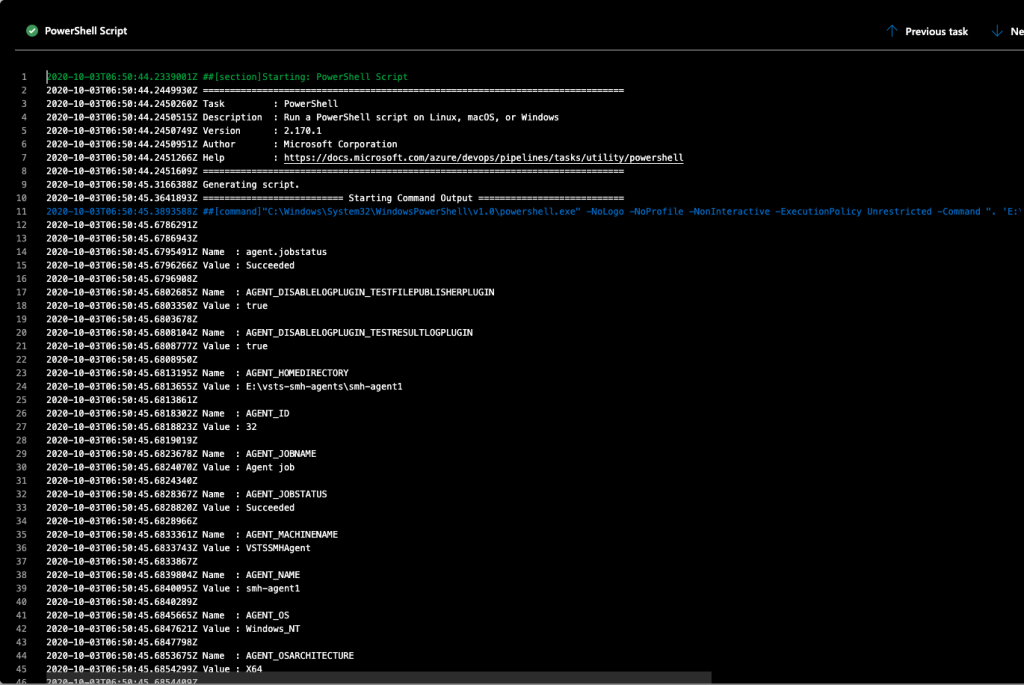
and after creation of a new release pipeline and execution of this pipeline you should have something like this:


Find blocked requests by Azure WAF in Log Analytics

Assuming that you have correctly connected Azure WAF to Log Analytics you can run a simple query to list all the requests that have been blocked by WAF

AzureDiagnostics
| where ResourceType == "FRONTDOORS" and Category == "FrontdoorWebApplicationFirewallLog"
| where action_s =~ "block"
| order by TimeGenerated desc 

Collecting IP addresses in Azure App Insights

When you want to collect IP addresses in Azure App Insights, you have to enable it. By default IP addresses are masked and you can only see some basic information like city or country.

If you want to enable this feature you can’t use Azure Portal, at least for now. The easiest way to do it, is to use Azure Resource Explorer.

  1. Go to https://resources.azure.com/ and pick proper AD you want to work with
  2. Click on Read/Write mode in top of the page.
  3. Find your App Insight instance by going into subscriptions / YOUR_SUBSCRIPTION / resourceGroups / YOUR_RESOURCE_GROUP / providers / microsoft.insights / components
  4. In Data tab click on Edit
  5. Remove the content of the properties property and put "DisableIpMasking": true
  6. Hit Patch button since we are changing the part of the resource definition.
  7. Done!

Example JSON payload

{
  "id": "/subscriptions/XXX/resourceGroups/XXX/providers/microsoft.insights/components/XXX",
  "name": "XXX",
  "type": "microsoft.insights/components",
  "location": "westeurope",
  "tags": {},
  "kind": "web",
  "etag": "\"XXX\"",
  "properties": {
    "DisableIpMasking": true
  }
}

Also this part of a documentation may be useful https://docs.microsoft.com/en-us/azure/azure-monitor/app/ip-collection


Pages:12